ParticleScope - Short Description
of Instrument

This non-destructive particle detection
and measurement system appears simple but is very versatile.
The Phoenix Imaging ParticleScope System provides the next great advancement
in non-destructive testing for the detection and measurement of contaminating
particles in clear solutions. The technology is the result of a ten-year
development effort and is protected by U.S. & International Patents, 5,365,343,
5,694,221, 6,498,645, 7,310,143, 7,391,515 & 7,430,047 and other patents
pending. The system provides an accurate NIST traceable linear relationship
between maximum particle size and the probability of its detection.
The ParticleScope System provides unique capabilities that are not available in
any other instrument of its kind. The functional design of the instrument
concentrates on two primary tasks, 1) the non-destructive detection of
contaminating particles in solution and 2) a NIST traceable measurement of the
particle size (equivalent diameter if the particle is within the aspect limits).
The system has a useful measurement range of 50 çm to 1000 çm. The optical
system is optimized for the detection of visible size particles, a size range
that previously required a calibrated microscope operated by a skilled
technician.
The art of detection has been advanced with the implementation of this
technology. Several factors contribute to the ability to detect the presence of
contaminating particles in solution. Product handling, agitation method,
illumination conditions, sensor field of view, detection angle, and the sensor
resolution are just a few of the important criteria that must be addressed in
order for the instrumentation to function properly. If any factor is compromised
the reliability of the instrument will be questionable and possibly jeopardize
the ability to validate the inspection process.
The basic premise of most commercially available automatic visual inspection
systems is that the equipment relies on the ability to identify differences
between one or more images. In other words, the system searches for things that
whose signal differs from that of the average scene illumination. The present
commercially available inspection systems can be described as a binary detection
systems.
"Detection" is not
"Measurement".
The ParticleScope System uses patented technology which evaluates the total
energy found in both the focused image and the blur surround within a three
dimensional envelope to obtain its demonstrated NIST traceable maximum particle
size accuracy.
It is assumed that only items of interest (contaminating particles) are the only
differences that are isolated. A system that detects the presence of a
contaminating particle may not report a consistent "detection level" when the
same product is examined a second time. This is by far the most difficult
problem for a reliable inspection system to overcome.
It has been demonstrated that a relationship exist between the intensity of the
illumination source and size of the particle that is detectable by the human
eye. A similar analogy exists between the image sensor of an automated detection
system and the size of the smallest detectable particle. Hence the more
consistent the illumination source, the more consistent the resulting detection
signal.
The direction of illumination will influence the detection of the particle.
It is very difficult to uniformly illuminate a cylindrical object. It is even
more difficult to illuminate the interior of liquid filled cylindrical container
in which the index of refraction of the contents is different from the
surroundings (air). The cylindrical container tends to act like a lens and will
distort the apparent size of an object inside its volume. This phenomenon makes
the task of consistently detecting a contaminating particle as it transverses
the field of view difficult and the measurement of its size even more so.
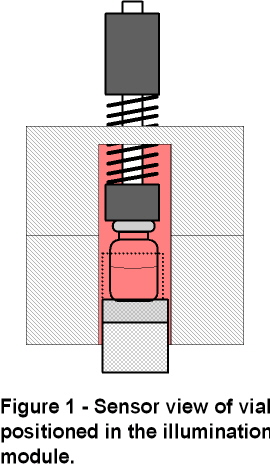
Despite its compact size (30" x 30" x 19"), this versatile particle size
analysis system detects the presence, absence, position, size and number of
particles in a container. Detailed image information is acquired using a high
resolution progressive-scan CCD sensor mounted and precisely aligned with
optical components within a sealed sensor enclosure. The optical path of the
sensor is positioned such that the entire bottom of the container is exposed. A
special illumination module equipped with nearly 1,000 matched LED's provide a
uniform illumination field. The illumination module is position so that the
optical axis coincides with the axis of rotation. The illumination module is
raised and lowered using a self contained linear actuator providing easy access
to the sample holding puck. The sample holding puck is attached directly to a
low inertia, high torque stepper motor drive. All major components with
exception of the image processor are contained in the base unit.
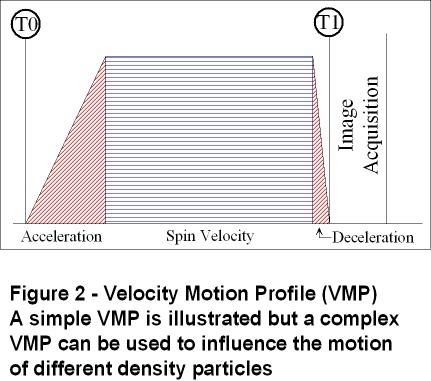
In the ParticleScope System the container is rotated using a drive system
capable of precise motion control. A plot of the rotational velocity verses time
(acceleration, duration at spin velocity, and deceleration) define a Velocity
Motion Profile (VMP) for the rotation of the container. The shape of the VMP is
a critical factor in the transfer of energy from the container to the fluid
contents. If the acceleration is too rapid, the spin is too violent or the
deceleration is incorrect then turbulent flow condition can be generated within
the container. Turbulent flow conditions will yield cavitation of the solution
and the production of air bubbles. It is nearly impossible to separate air
bubbles from contaminating particles under these conditions. The VMP is
influenced by the container's shape, size, volumetric fill level, surface
tension and viscosity of the solution. When the VMP is optimized the particles
are set into motion without the creation of turbulent flow or distortion of the
meniscus.
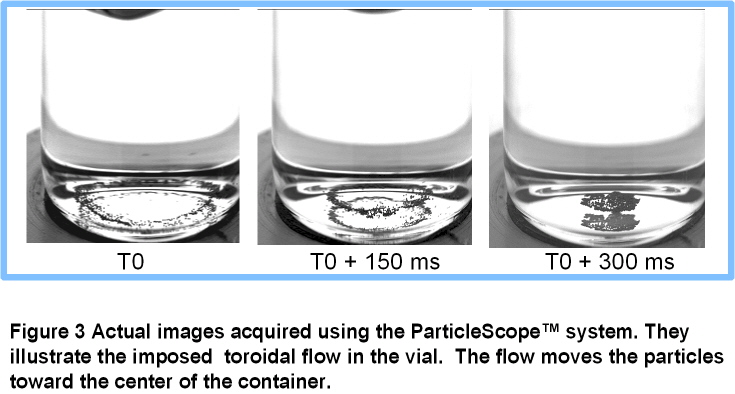
During development of this technology the system fluid dynamics for a SVI
(small vial for injection) was clarified. Common belief implied that by spinning
the container rapidly, the fluid and particles were forced out away from the
center. While this is true during the spin segment the flow changes shortly
afterwards. As can be seen in Figure 3 below, a large number (~100) of 100 çm
diameter particles were placed in a sealed container with WFI. An acceptable VMP
was used for agitation and several images were acquired in succession after zero
velocity was reached. The fluid dynamics in the container created by the VMP
produced a toroidal flow pattern aligned with the axis of rotation. The toroidal
effect is generated when fluid at the fluid/air surface is forced toward the
wall of the container and then down the walls toward the bottom. At the bottom
the fluid moves toward the center, pulling the heavy contaminating particles
(density > fluid) with it. The fluid flow continues upward toward the fluid/air
interface in a toroidal manner.
The purpose of rotating the container with a defined VMP is to set the
solution, and the particles within it, into motion using controlled fluid
dynamics. By controlling the velocity motion profile precisely the contaminating
particles will move within the solution in a predictable manner. After a
predetermined period of time has elapsed the contaminating particle(s) will be
positioned in predictable volume within the container.
Extremely light particles (low density) will continue to adhere to the
fluid/air interface if insufficient energy is available to overcome the surface
tension. Neutral density contamination (density ~ fluid) positioned outside the
toroidal flow surface will move with the fluid flow in that region. The figure
below clearly demonstrates that the particles are initially centrifuged to the
wall of the container. At the end of rotation, particles that had been
centrifuged to the container walls by the VMP collapse to the perimeter of the
container's bottom surface. However, after a short duration the fluid dynamics
begins to concentrate the particles in the center of the container about the
axis of rotation.
It should be noted that the larger higher density particles tend to stay on
the bottom of the container when the proper VMP is applied and that they tend to
settle (stop their movement) very quickly (<150 ms) after spin is complete. This
movement of the particles with a specific VMP is very predictable and leads to
the basis of the ParticleScope patented technology.
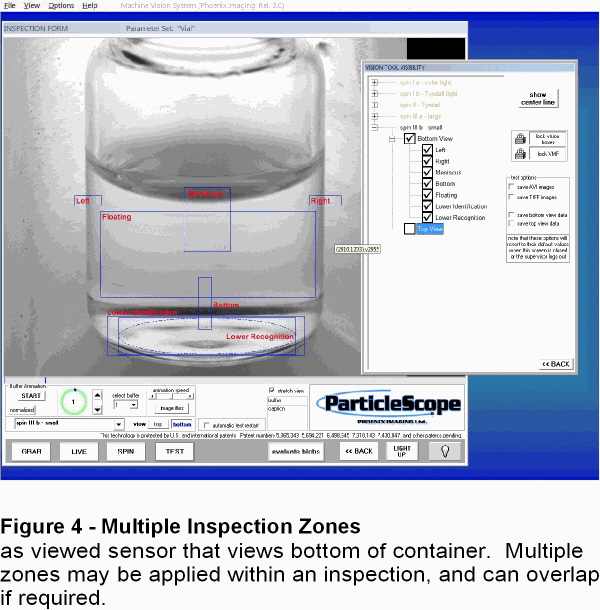
ParticleScope can use multiple
inspection zones (volumes) that can be placed in strategic positions within the
field of view. The window positions are based on experimental trials and known
trajectories of sized particles. Figure 4 illustrates the placement of
multiple inspection zones within
a container. When using more than one sensor the inspection zones may overlap
each other. If a particle travels through an inspection zone it can be measured
precisely. If a particle does not move in an calibrated inspection window it
will be detected and reported as contamination without an actual measurement of
equivalent diameter being reported.
The windows that inspect the bottom of the container offer
better measurement capability than those above them. This is because the
particle's X, Y and Z position within the container is well know and
allows for an apparent size correction.
The system provides automatic adjustment windows to
compensate for movement of fluid. The Meniscus window will track
the lower level of the meniscus and automatically keep the top of the "Floating"
window a set distance below it so that you do not get "False Rejects" because
the surface of the fluid moved into an inspection window. The Right
and Left windows are used to find the edge of the container. The
centerline of the container is calculated from the Right and Left window
positions so that the inspection windows automatically align with respect to the
centerline during each inspection.
The windows can be set to be visible or invisible.
The windows can also be set to active or inactive.
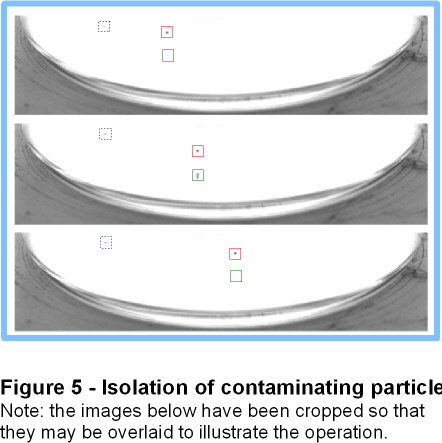
Figure 5 illustrates the systems ability to track the
particle in multiple images. The normal mode of operation for the system is to
isolate and measure the particle in a minimum "n" images before reporting the
equivalent diameter, 6 - 10 images is typical. As can be seen in the images
below the system will isolate a particle and then identify its reflection and
eliminate it from the test results. The system will also ignore stationary image
items which may be a blemish on the container. A blemish is represented by the
dotted line box in the images. Notice that the container blemish does not move
between images and it is ignored. The reflection of the particle can also
be seen in the images and it is recognized as following the path of the particle
and it is also ignored in particle size calculation.
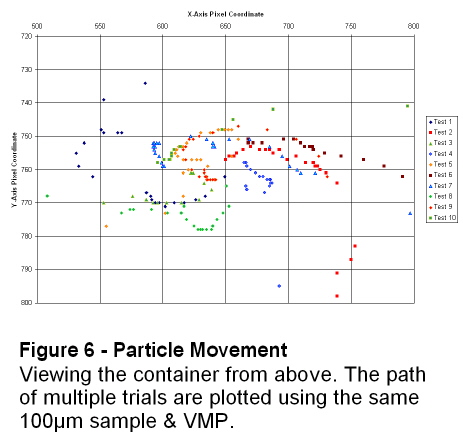
Figure 6 illustrates the particle movement of 10
inspections using the same 100çm SS ball seeded in a 5 ml vial with 3 ml fill
WFI. Each symbol represents another trial using the same VMP and illustrates the
migration of the particle from the extremes toward the center of the container
(Zone 1 Center).
The particle during initial agitation is moved to the
perimeter wall of the container. However, soon after the container stops
its rotation, within 150 milliseconds, the fluid begins to setup a toroidal
flow. The higher density particles that rest on the bottom of the
container tend to begin moving toward the center of the container. In all
cases the particle is drawn to a small region in the center of the container and
this provides a well defined inspection area that yields consistent results.
The more images with the particle in this central region
the better the measurement accuracy. We typically acquire 25 images during the
final phase and of those 10 -15 images are within 1 sigma of the mean particle
size. The lower density particles will tend to stay in motion longer and
usually appear in the area above the container bottom.
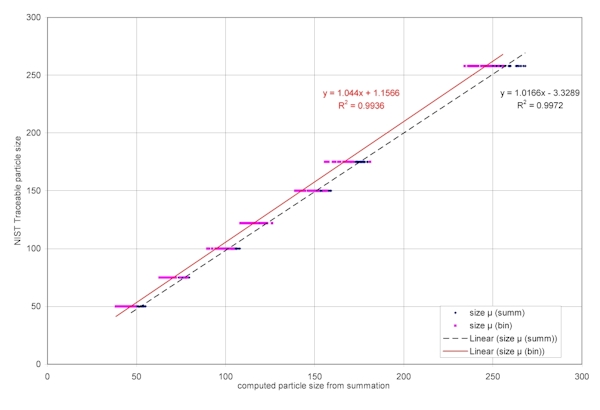
Figure 7 illustrates a typical "Calibration Curve" for the ParticleScope.
The curve is produced by plotting the particle size as reported by the
instrument vs. the actual size of the NIST traceable standard sample. The
linearity of the curve produces an Rý fit of better than 0.995 from 50çm to
300çm for the Grayscale Summation values.
The error associated with the Grayscale Summation is about one-third that of the
Binary measurements. The Binary Measurements are much better than most
non-destructive particle measurement instruments because of the patented
illumination system implemented in the ParticleScope instrument. The data
range for a particular size particle increases as the actual particle size gets
larger because it tends to have more measurements outside the central region.
The Grayscale Summation values do not increase as much because we integrate the
grayscale associated with the particle whether they are in focus or not.
Figure 7 - Particle Size vs Binary and Grayscale
Summation Values.
|